InspectorG provides a software tool to measure the optical flatness of a glass sample by capturing a reflected or transmitted digital image of a grid and creating tabular and graphical mappings of the distortion at each area of the sample. A rectangular grid that is slightly larger than twice the size of the measured sample is used so that the grid reflection covers the entire surface of the sample as viewed from the camera perspective. The analysis may be selected to cover the entire sample surface as the default or selected smaller areas may be outlined with a mouse for more detailed measurements. The only equiptment required is a mounting rack for the sample, a flat black and white rectangular grid, and a consumer level digital camera. An image is selected in the normal windows way as shown in the following screen.
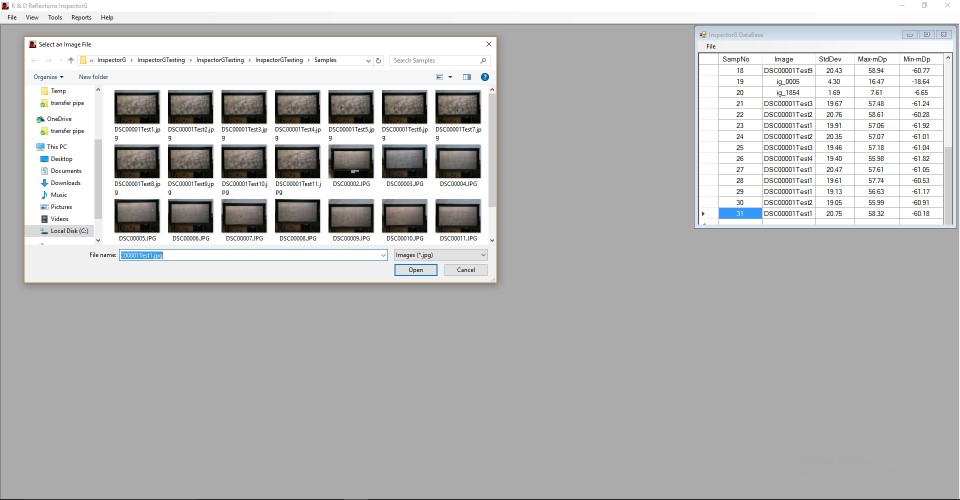
From the file menu in the inspectorG Software, select Open Picture. When your picture is open, right click on the picture and select analyze from the drop down menu, or click on the analyze button on the toolbar. If any custom details are selected in the options window this will open a Sample Information sheet. If no custom data is used, the analyisis will begin immediately and open the report window on completion. Also, all details will be saved in the sample database where selected parts are displayed.
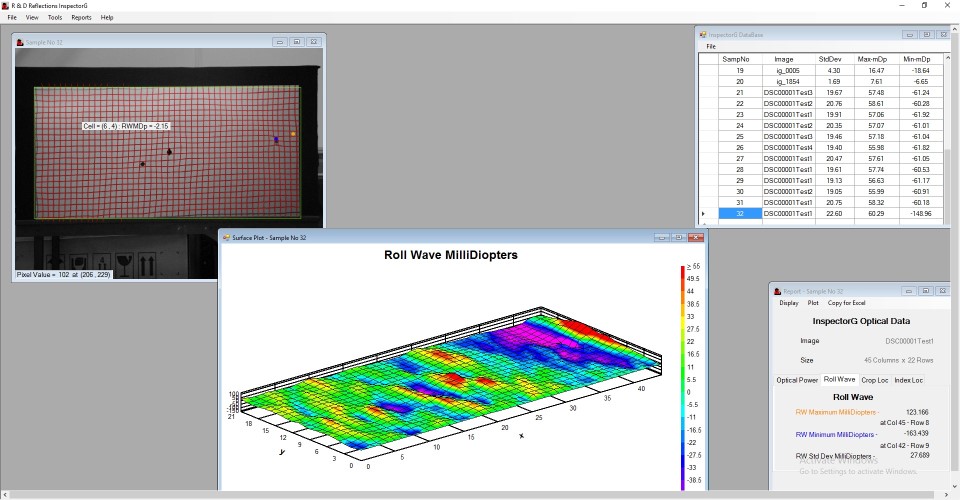
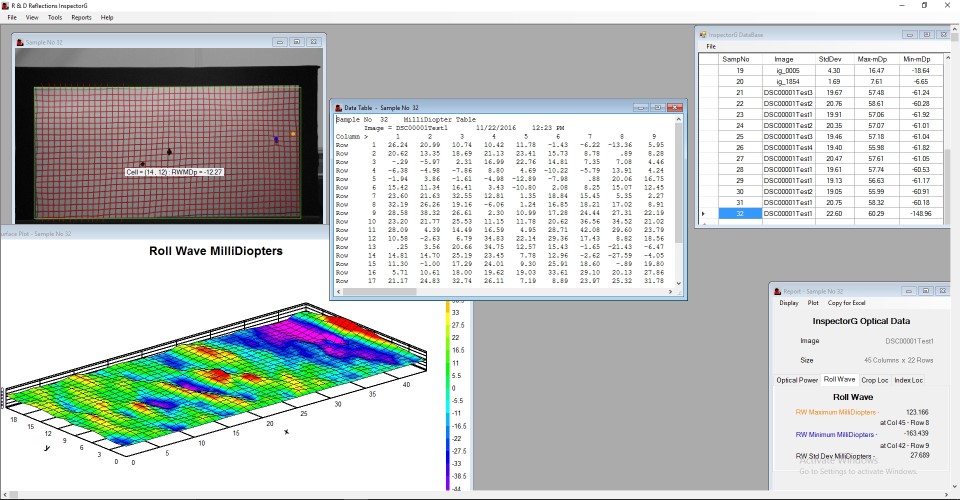
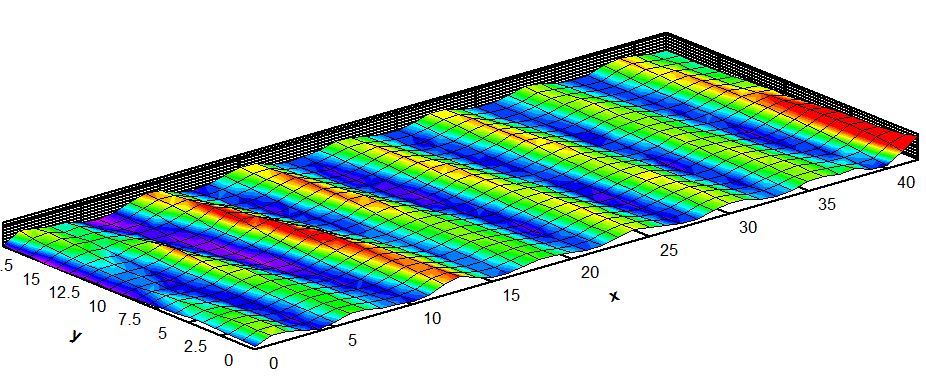
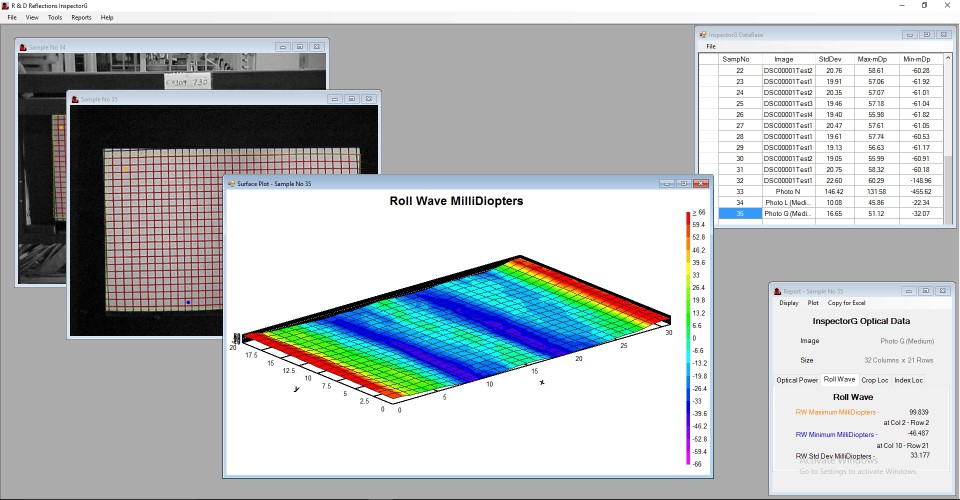
Two types of plot are available that depict the local curvature of the sample at each cell in the image. Rollwave MilliDiopters represent the local cylindrical curvature that is the dominant characteristic of tempered glass produced on a horizontal roll bead furnace. The plot is automatically displayed if the autoplot option is selected in the option menu.
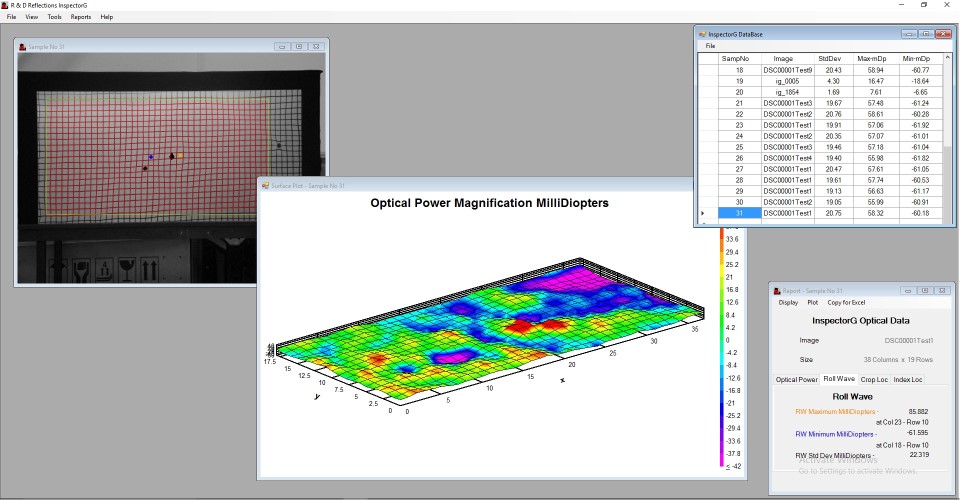
The second option is called optical power and is presented when selected in the tab of the report form. For a more detailed explanation of these values see the physics section.
Extensive detail data is produced during the analysis and is available in tabular form from the report menu. This data includes measurement of all grid line locations, intersections, cell areas, cell widths, and cell milliDiopter values. All data can be exported in Excel format for additional examination if desired.